Statewide unemployment numbers tell only part of the story in Kentucky. The state's 120 counties have very different economies, from the growing suburbs of Northern Kentucky and the Bluegrass region to rural counties in the east still adjusting to the decline of coal. For employers deciding where to locate, expand or recruit, county data offers a sharper view.
What the summer data showed
The Kentucky Center for Statistics, known as KYSTATS, reported that unemployment rates fell in 87 counties in July compared with the same month a year earlier, rose in 18 and held steady in 15. The statewide unadjusted rate was 5.1 percent in July, down from 5.6 percent in June.
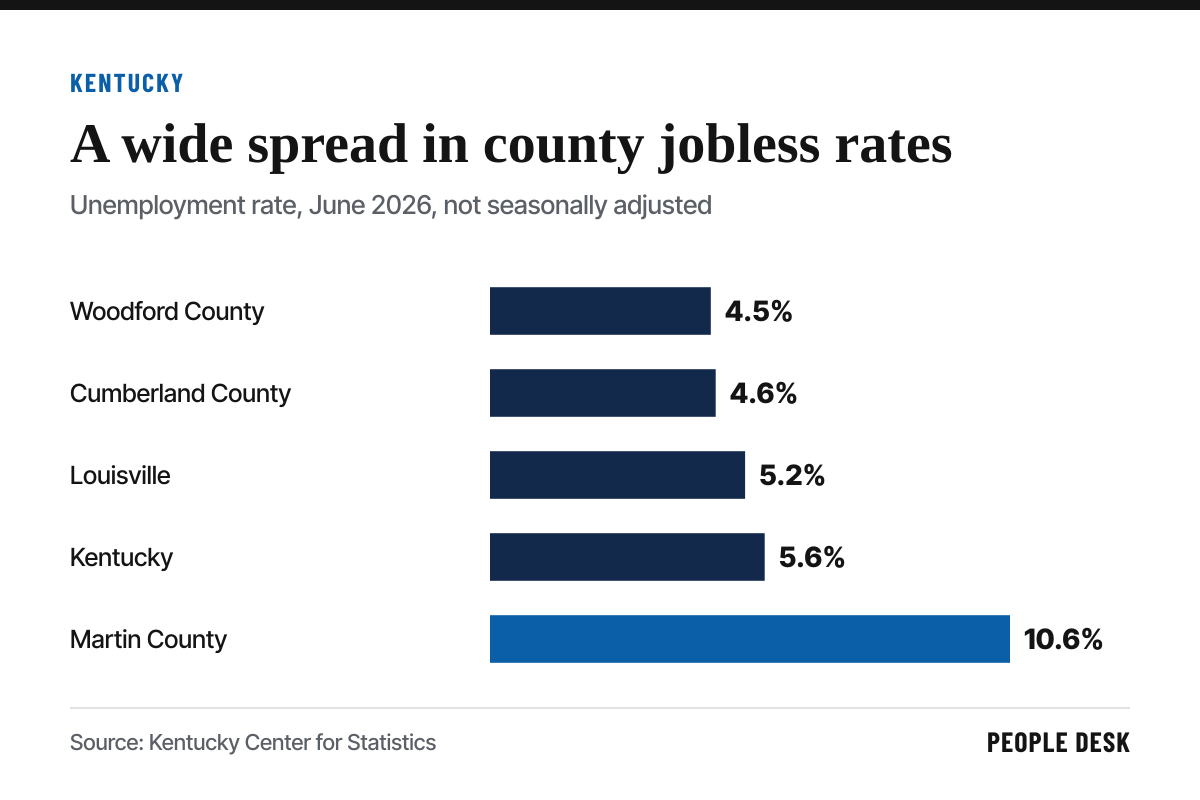
June figures showed the spread clearly. Woodford County, in the Bluegrass region between Lexington and Frankfort, had the lowest rate at 4.5 percent, followed closely by Cumberland County at 4.6 percent. Martin County in Eastern Kentucky had the highest rate at 10.6 percent. Louisville's rate was about 5.2 percent, compared with a national rate of 4.4 percent.
Northern Kentucky, part of the Cincinnati metro area, has consistently posted some of the lowest rates in the state, around 4.3 percent in July.
Earlier in the year, rates were rising. In May, unemployment rose in 95 counties, and Martin County's rate stood at 9.8 percent, according to state data.
How to read county numbers
County unemployment rates are not seasonally adjusted. That means they move with seasonal patterns, such as school schedules, agricultural work and holiday retail hiring. Comparing one month with the month before can be misleading. The better comparison is the same month a year earlier, which is how KYSTATS reports its county changes.
Small counties can also show large swings because their labor forces are small. A single plant closing or opening can move the rate significantly.
Rates also depend on where people live, not where they work. A county with a large employer may still post a higher rate if many of the plant's workers live elsewhere.
Unemployment rates also count only people actively looking for work. Counties with low labor force participation may have many working-age adults who are not counted as unemployed because they are not searching. Kentucky's participation rate has trailed the national average for years, as we explained in our report on Kentucky's labor force.
What it means for employers
In low-unemployment counties, competition for workers is intense. Employers in Woodford, Scott, Oldham and Boone counties often compete with large manufacturers and logistics operations for the same people. Pay, scheduling and reputation matter a great deal in those markets.
In higher-unemployment counties, more workers may be available, but barriers can be significant. Transportation, childcare, health issues and gaps in work history may keep people out of jobs. Employers willing to train workers and address those barriers can find motivated candidates. We describe some of those barriers in our report on barriers to work.
Commuting patterns matter. Many workers travel across county lines. A plant in a tight labor market may draw workers from neighboring counties with higher unemployment, especially if it offers transportation help or shift times that fit long commutes.
Using the data
KYSTATS publishes county unemployment data each month. Employers can use it alongside other sources, such as commuting data, wage surveys and job posting trends, to understand local labor markets.
For site selection, look beyond the headline rate. A county with moderate unemployment and a large working-age population nearby may offer more available workers than one with high unemployment and few residents.
For recruiting, consider expanding outreach to neighboring counties. Partnerships with local workforce boards and community colleges can help reach job seekers in those areas.
For pay planning, compare wage data for the same counties. Tight markets often push starting wages above regional averages, and employers that set pay from statewide surveys may fall behind.
The broader picture
Kentucky's labor market reflects national trends with local twists. The national economy added 165,000 jobs in October, as we reported in our October jobs report analysis. Kentucky industries such as bourbon, logistics and manufacturing are each facing their own pressures, covered in our bourbon industry report and our report on UPS.
County data helps employers see where those pressures land. In a state as varied as Kentucky, the right recruiting strategy in Boone County may look very different from the right strategy in Pike or Martin County.
Employers that track local conditions, rather than relying on statewide averages, can set more realistic hiring goals and spend recruiting dollars where they are most likely to pay off.
Sources
- Kentucky Center for Statistics, July 2026 Unemployment Report
- Kentucky Center for Statistics, June 2026 Unemployment Report
- The Lexington Times, Kentucky Unemployment Rises to 4.5% in May
- USAFacts, Unemployment Rate in the Louisville KY-IN Metro Area
We link to the original reports and filings wherever possible. See something we got wrong? Tell us and read our corrections policy.


