Each month, the jobs report tells employers how many jobs were added and what the unemployment rate was. A second report, released about a week earlier but covering an earlier month, often tells HR teams more about the conditions they face. The Job Openings and Labor Turnover Survey, known as JOLTS, measures how many jobs employers are trying to fill, how many people they hire and how many workers leave.
What JOLTS measures
The Bureau of Labor Statistics collects JOLTS data from a sample of businesses and government agencies. The survey tracks three main categories.
Job openings are positions that are open on the last business day of the month. To count, a specific job must exist, work could start within 30 days, and the employer must be actively recruiting from outside the organization. Openings measure unmet demand for workers.
Hires are all additions to the payroll during the month, including new employees, rehires and seasonal workers. Separations are all departures, divided into quits, layoffs and discharges, and other separations such as retirements and deaths.
Each measure is reported as a level and as a rate. The openings rate compares openings with total employment plus openings. The quits rate compares quits with total employment.
What September showed
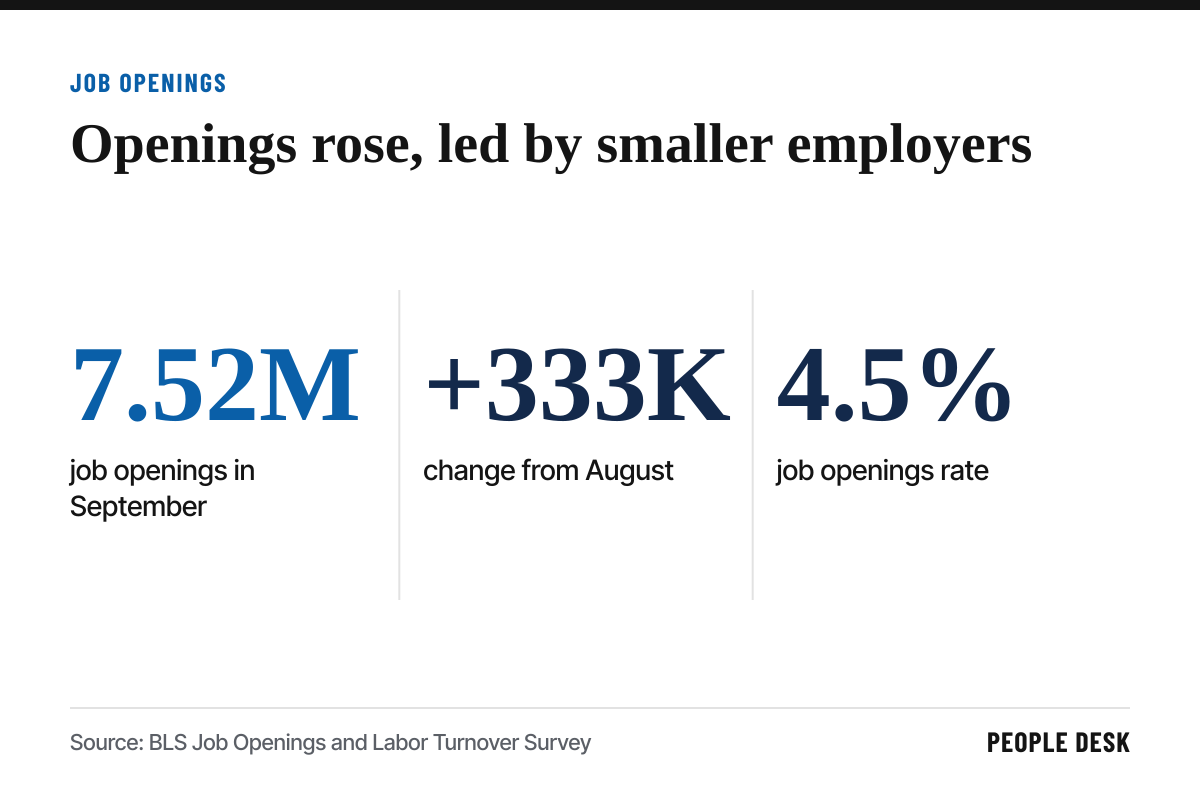
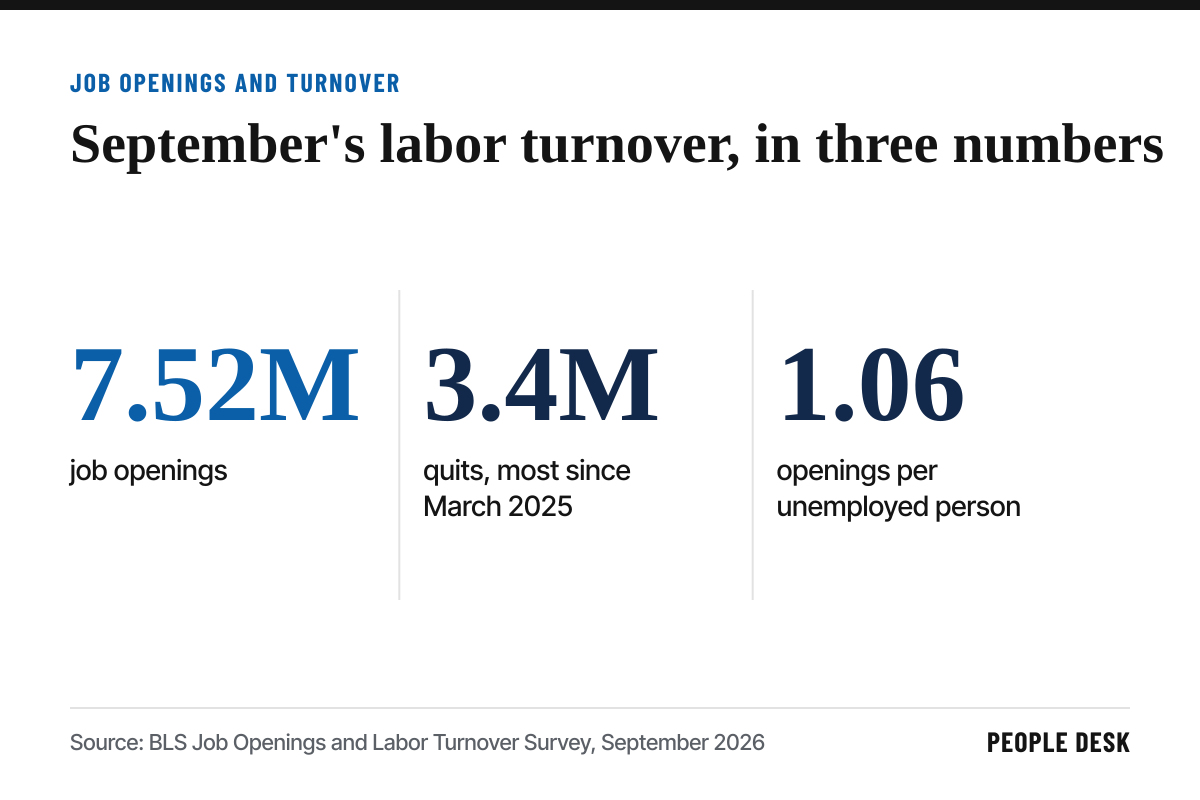
The September report showed openings rising by 333,000 to 7.52 million, with the openings rate at 4.5 percent. There were about 1.06 openings for every unemployed person, meaning roughly one available job for each job seeker. Nearly all of the increase came from small and medium-sized businesses, as we reported in our September JOLTS analysis.
Quits rose to 3.4 million, the highest level since March 2025. Accommodation and food services led the increase, a pattern we explore in our hospitality turnover report.
Why quits matter most to HR
Economists often watch quits as a measure of worker confidence. People are more likely to leave a job voluntarily when they believe they can find a better one. Rising quits tend to signal a tighter labor market and upward pressure on pay.
For HR teams, quits are also a direct measure of retention risk. When the national quits level rises, employers in the most affected industries should expect more resignations and more competition for replacements. Our guide to stay and exit interviews covers ways to respond.
Reading the ratio
The number of openings per unemployed person is a simple gauge of how tight the labor market is. When it is well above one, employers are competing for a limited pool of candidates. When it falls below one, job seekers outnumber openings and employers have more choice.
The current ratio, near one, suggests a balanced market overall. But the national figure hides wide differences by industry and region. Skilled trades, health care and many technical roles remain far tighter than the average, as described in our report on the skilled trades.
Limits to keep in mind
JOLTS data arrives with a lag. The report released in early November covered September. Estimates are also revised, and openings can be affected by how employers post jobs, including postings left open for roles they are not actively filling.
The BLS also publishes state estimates, which allow employers to compare their own state with the national picture. These are less precise than the national numbers but useful for broad comparisons.
Hires and layoffs deserve attention too. A market where hires are falling while openings hold steady suggests employers are posting jobs but struggling to fill them. A rise in layoffs and discharges usually shows up in JOLTS before it appears in the unemployment rate.
Putting it to work
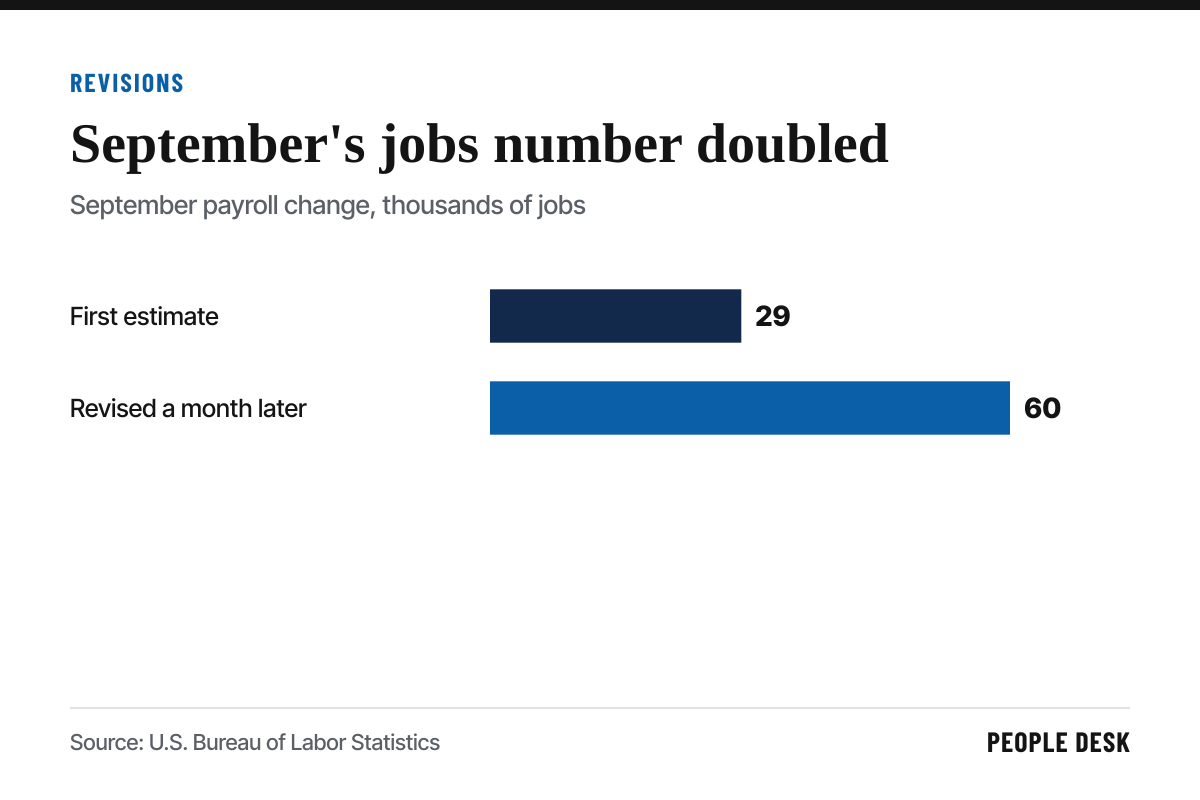
Use JOLTS alongside the monthly jobs report, explained in our guide to jobs report revisions. Payroll growth shows the net change in employment. JOLTS shows the churn underneath it, including how many people are being hired and how many are leaving.
Compare your own data with the national numbers. If your quit rate is well above the national rate for your industry, retention problems may be specific to your organization rather than the market. If your time to fill is rising while national openings are falling, your hiring process may need attention.
JOLTS will not tell any single employer what to do. But read monthly, it offers one of the clearest views of how hard it is to hire and keep workers.
Sources
- U.S. Bureau of Labor Statistics, Job Openings and Labor Turnover Summary
- U.S. Bureau of Labor Statistics, JOLTS Definitions
- Honolulu Star-Advertiser via Reuters, U.S. Job Openings Jump as Resignations Surge
We link to the original reports and filings wherever possible. See something we got wrong? Tell us and read our corrections policy.