Pay decisions are among the most consequential choices an employer makes. Set wages too low and positions sit open while turnover climbs. Set them too high and budgets strain. Most employers rely on salary surveys from consulting firms, but free federal data can fill in much of the picture, if employers know which measure to use.
Average hourly earnings
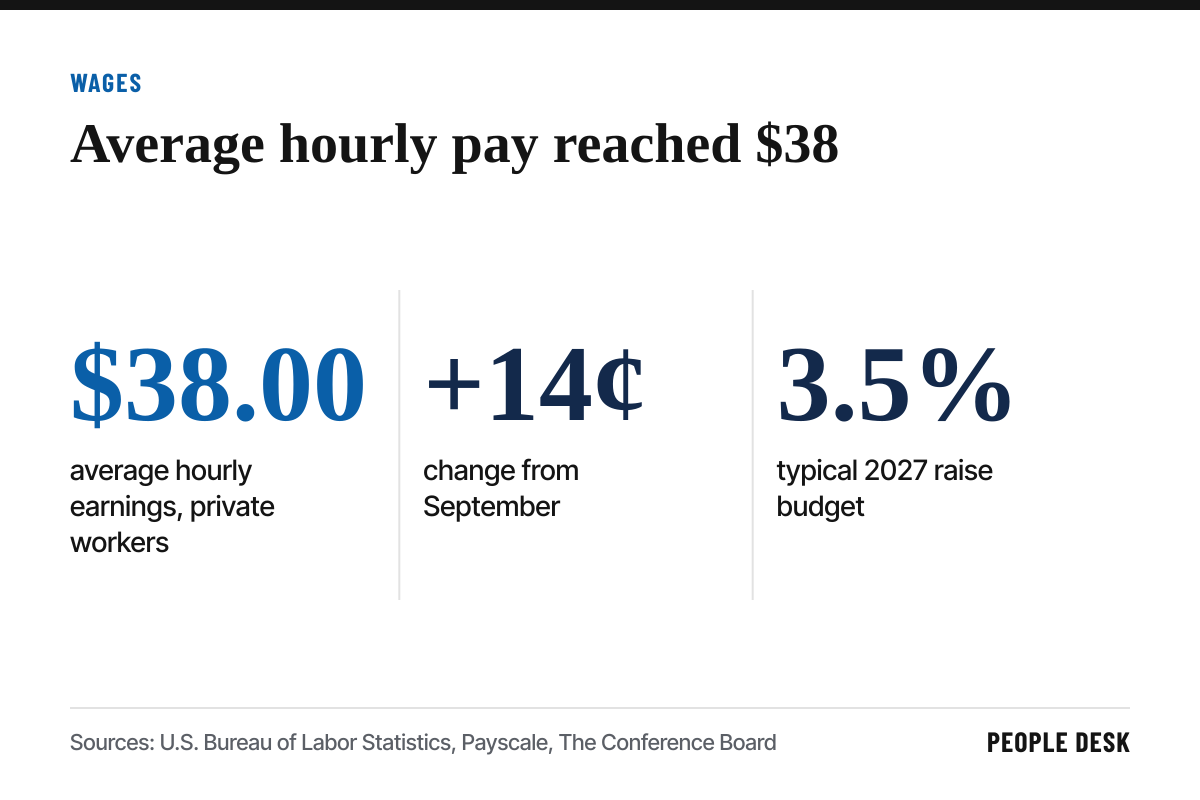
The monthly jobs report includes average hourly earnings for private nonfarm workers. In October, that figure rose 14 cents to $38.00, according to the Bureau of Labor Statistics, as we noted in our October jobs report analysis.
Average hourly earnings are useful for spotting national trends, but they have limits. The figure is an average across all private jobs, so it shifts when the mix of jobs changes. If low-wage industries cut workers, the average can rise even if no one received a raise. The measure also excludes benefits.
The Employment Cost Index
The Employment Cost Index, published quarterly, measures changes in the cost of employing workers while holding the mix of jobs constant. That makes it a cleaner measure of underlying wage growth than average hourly earnings. It covers both wages and benefits, and it breaks results out by industry, occupation group and region.
Many compensation professionals use the ECI to judge whether their own pay growth is keeping up with the market. If the ECI for your industry is rising faster than your raise budget, you may be falling behind.
Occupational wage data
For setting pay for specific roles, the most useful federal source is Occupational Employment and Wage Statistics, known as OEWS. It reports employment and wage estimates for hundreds of occupations across the nation, states and metropolitan areas, including Louisville and other Kentucky metros. Data includes median wages and percentiles, which show the range from entry level to experienced workers.
Employers should match their jobs to the occupational definitions carefully. A title like coordinator or specialist can mean very different work at different companies. Compare actual duties with the standard occupation descriptions before relying on a wage figure.
OEWS data is released annually and reflects conditions several months earlier, so employers in fast-moving markets should adjust for recent wage growth. It is still one of the best free tools for comparing local pay by job.
Benefits matter too
The BLS Employer Costs for Employee Compensation survey shows how total compensation splits between wages and benefits. For private industry workers, benefits make up roughly 30 percent of total compensation. Employers that communicate the value of benefits clearly can compete even when base pay is close to market, as we explain in our guide to total rewards statements.
Putting the data together
Start with OEWS for the occupation and metro area. Use the median as a reference point and the 25th and 75th percentiles to understand the range. Adjust for time since the data was collected using ECI trends.
Compare with your own data. Look at offer acceptance rates, time to fill and turnover by role. If candidates are turning down offers or new hires are leaving within months, pay may be part of the reason.
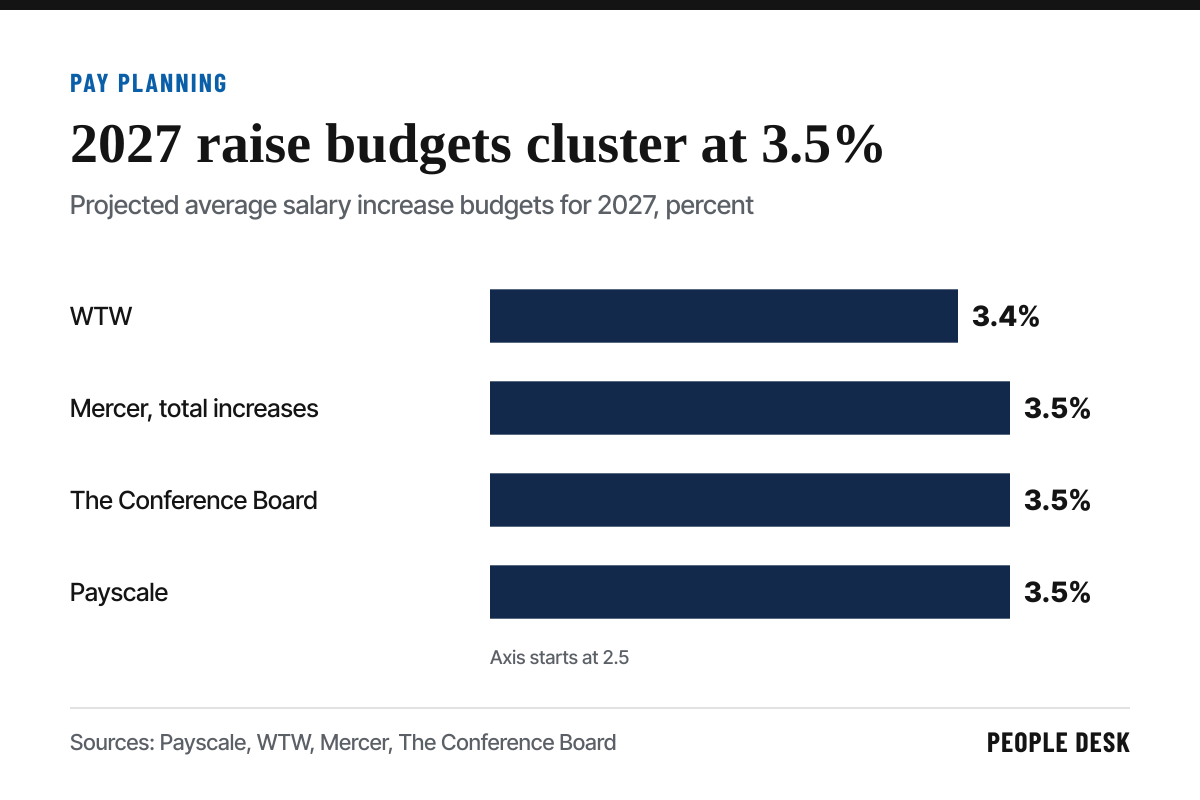
Consider raise budgets in the market. Employers are planning salary increase budgets of about 3.5 percent for 2027, according to Payscale, Mercer and The Conference Board, as we reported in our salary budget report. Roles in short supply may need adjustments beyond the standard budget.
Internal equity deserves the same attention. When the market rate for new hires rises faster than raises for current staff, experienced employees can end up paid less than people they are training. That pattern, called pay compression, is a common driver of resignations among long-tenured workers.
Check pay transparency requirements. Sixteen states plus Washington, D.C. require some form of pay disclosure in job postings or on request, as explained in our pay transparency guide. Published ranges also give candidates a basis for comparison, so internal consistency matters.
Review regularly
Markets move. A pay structure set once and left alone for years will drift out of line with the market, especially for skilled trades, nursing and technical roles where wages have risen quickly. Review market data at least annually, and more often for hard to fill roles.
Federal wage data will not replace a carefully designed compensation program. But it gives employers of every size a free, reliable starting point for decisions that shape hiring and retention.
Sources
- U.S. Bureau of Labor Statistics, The Employment Situation for October 2026
- U.S. Bureau of Labor Statistics, Employment Cost Index
- U.S. Bureau of Labor Statistics, Occupational Employment and Wage Statistics
- U.S. Bureau of Labor Statistics, Employer Costs for Employee Compensation
We link to the original reports and filings wherever possible. See something we got wrong? Tell us and read our corrections policy.