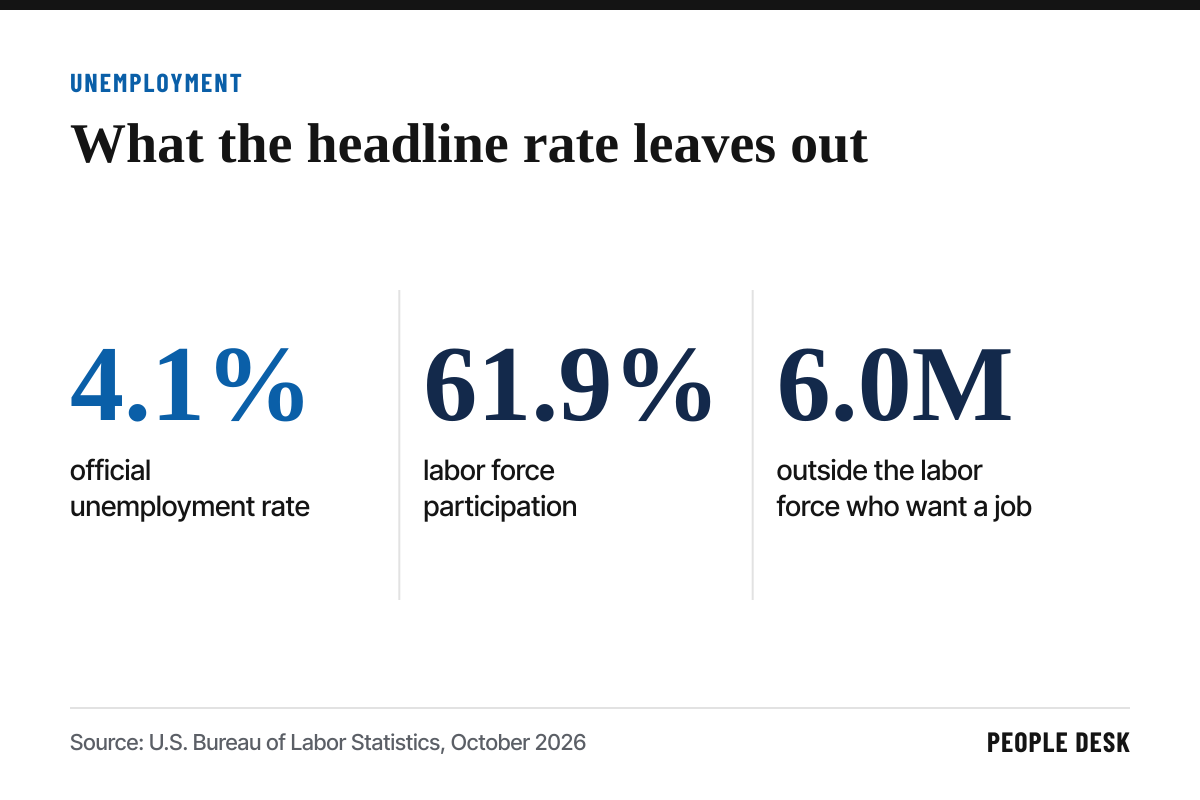
The unemployment rate is the most quoted labor statistic in the country. In October it was 4.1 percent. But that figure is a narrow measure by design. It counts only people who do not have a job, are available to work and actively looked for one in the past four weeks. Millions of people who could fill open roles fall outside that definition.
How the official rate works
The unemployment rate comes from the Current Population Survey, a monthly survey of households conducted by the Census Bureau for the Bureau of Labor Statistics. Each person surveyed is classified as employed, unemployed or not in the labor force.
The official rate, called U-3, divides the number of unemployed people by the labor force, which is everyone employed plus everyone unemployed. People who are not working and not looking are left out of both the numerator and the denominator.
The six measures
The BLS publishes six alternative measures of labor underutilization in Table A-15 of the monthly jobs report. They range from U-1, which counts only people unemployed for 15 weeks or longer, to U-6, the broadest.
U-4 adds discouraged workers, people who want a job and have looked in the past year but have stopped searching because they believe no jobs are available. U-5 adds all marginally attached workers, which includes discouraged workers and others who want work and searched recently but are not currently looking for other reasons.
U-6 adds people working part time for economic reasons. These are workers who want full-time work but have only part-time hours because their hours were cut or they could not find full-time jobs. U-6 is always higher than the official rate, often by several percentage points.
The people on the sidelines
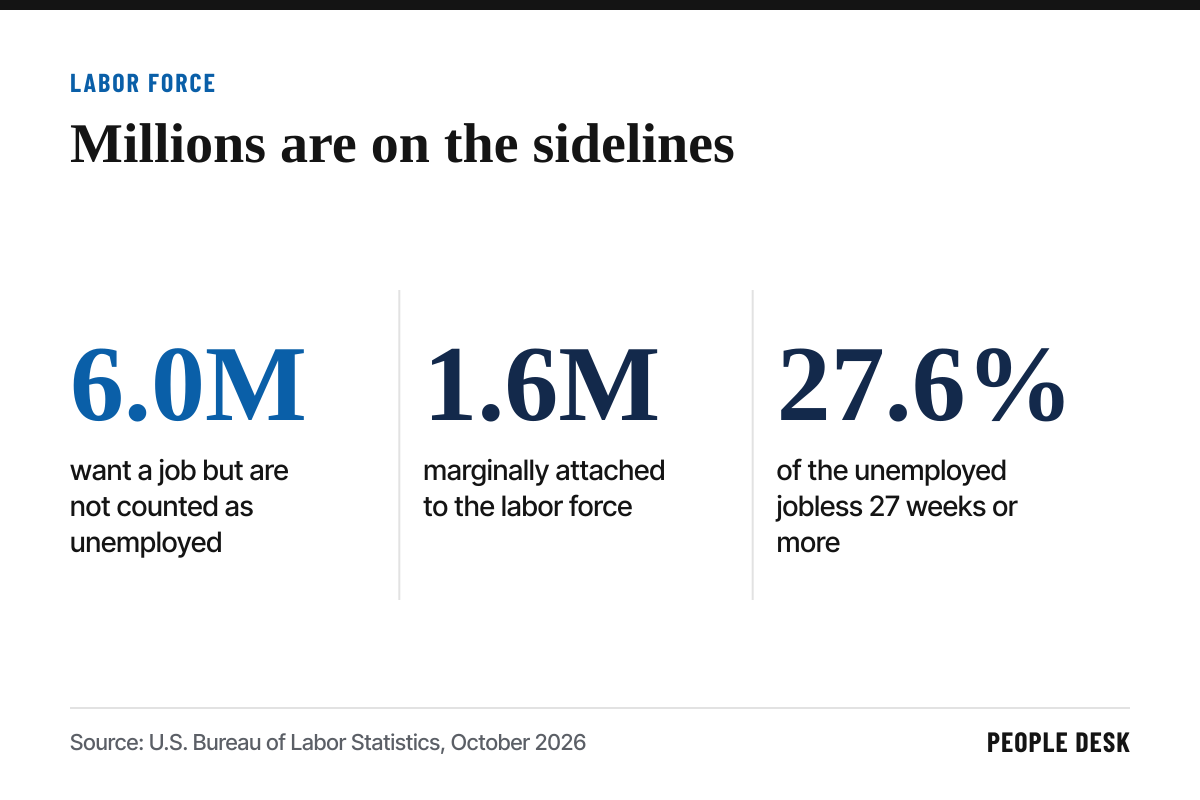
In October, about 6.0 million people outside the labor force said they currently want a job, according to the BLS. About 1.6 million were marginally attached to the labor force. Long-term unemployed workers, those jobless for 27 weeks or more, made up 27.6 percent of all unemployed people, as we covered in our report on workers on the sidelines.
The labor force participation rate was 61.9 percent in October. Participation reflects both long-term trends, such as an aging population, and shorter-term factors, such as caregiving and health. In Kentucky, participation has trailed the national rate for years, as explained in our report on Kentucky's labor force.
Why employers should care
A low official unemployment rate can make the labor pool look smaller than it is. People who are not counted as unemployed may still take the right job if it fits their circumstances, such as a parent who would work during school hours or a retiree who wants part-time work.
Part-time workers who want more hours are another overlooked pool. An employer that offers full-time schedules or additional shifts may attract workers already employed elsewhere part time.
Reaching these groups often requires removing barriers. Flexible schedules, transportation help, child care support and fair chance hiring can bring people back into the workforce. Our report on barriers to work in Louisville describes local examples.
Reading the numbers
Look at U-3 and U-6 together. When both are low, labor is tight across the board. When U-6 rises faster than U-3, more people are stuck in part-time jobs or giving up the search, which can signal weakening demand before the official rate moves.
Watch participation alongside unemployment. A falling unemployment rate is good news when people are finding jobs. It is less encouraging when it falls because people stopped looking.
Pay attention to the reasons people give for not working. Caregiving, school, illness and retirement each call for a different response from employers, and the BLS publishes those breakdowns in its monthly tables on people not in the labor force.
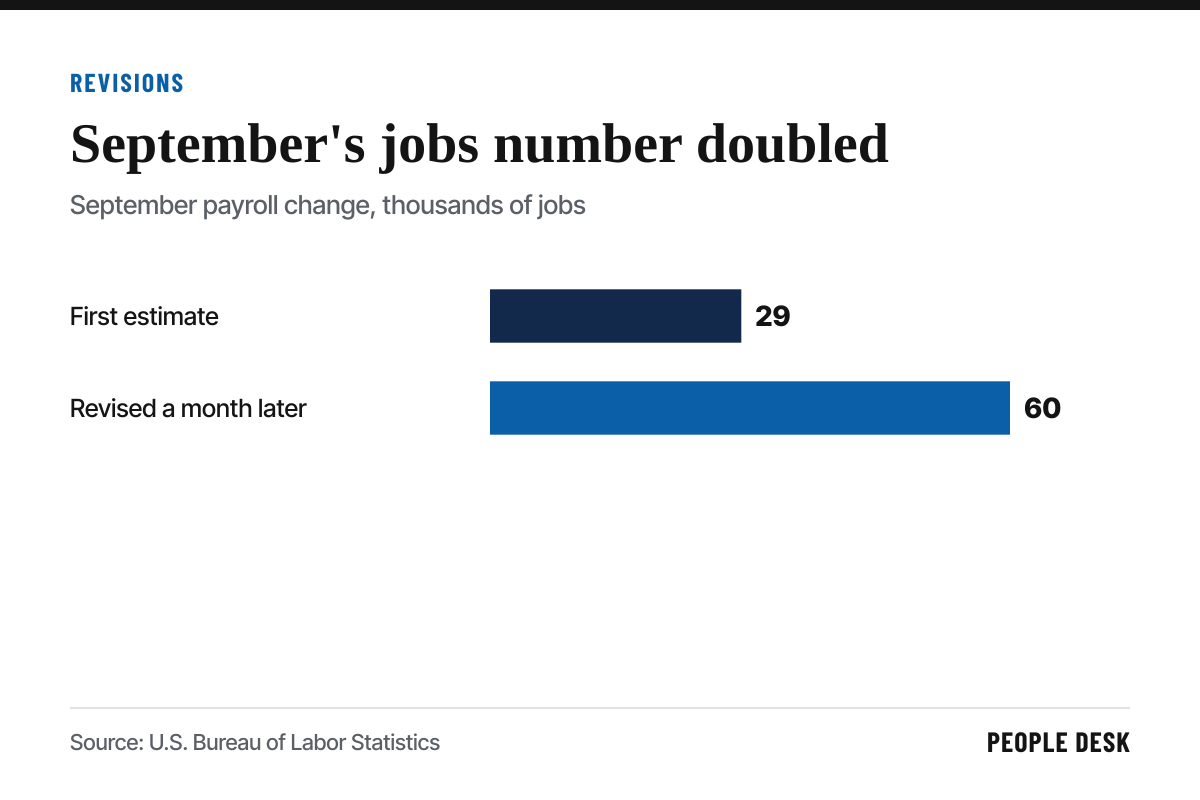
Remember that household survey data is volatile from month to month. Trends over several months are more reliable than any single reading, a point we make about payroll data in our guide to jobs report revisions.
The official unemployment rate is a useful benchmark, but it describes only part of the potential workforce. Employers who look beyond it, to discouraged workers, part-timers who want more hours and people who left the labor force for caregiving or health, may find candidates their competitors overlook.
Sources
- U.S. Bureau of Labor Statistics, Alternative Measures of Labor Underutilization, Table A-15
- U.S. Bureau of Labor Statistics, The Employment Situation for October 2026
- U.S. Bureau of Labor Statistics, Current Population Survey
We link to the original reports and filings wherever possible. See something we got wrong? Tell us and read our corrections policy.